
Whenever I introduce my business to people and explain what we do, people immediately think about presenting research in infographics.
And indeed infographics are one of the four research support products available to our clients.
In this post we will cover their definition, why they are useful for presenting research and offer some concrete examples of public sector organisations that use infographics to disseminate results.
This post is part of a 4-part blog series on the main visual outputs useful for research communication:
- Infographics
- Visual Summaries
- Policy Briefs
- Illustrations & Infocomics
Are you ready to find out learn more about presenting research in infographics?
Let’s begin!
What are infographics?
Infographics (abbreviated from ‘information graphic’) represent ‘the visualisation of data or ideas that tries to convey complex information to an audience in a manner that can be quickly consumed and easily understood’ (Smiciklas, 2012).
In other words, infographics facilitate visual learning between information and graphic design, and it’s currently the most effective way to tell a story and deliver instant knowledge.
Crucially, this tool does not oversimplify research into pictures, and instead, it is used as a gateway to the actual research report.
A crystallised main message is a valuable way to engage and ignite the interest of audiences to further explore certain topics.
Moreover, the legibility of data in infographics allows the information to have immediate practical application.
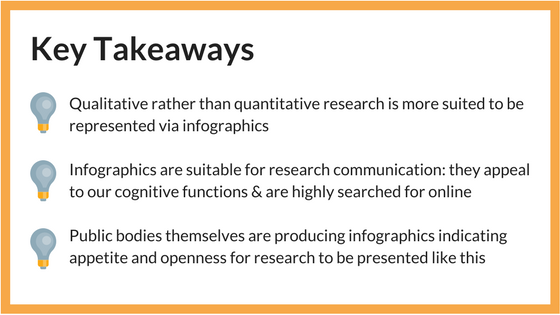
The key to whether presenting research in infographics is suitable for you depends on whether your research is more qualitative or quantitative.
As you can probably imagine, research that is more quantitative lends itself better to this type of visualisation.
Benefits for presenting research in infographics
Infographics appeal to the cognitive functions of the brain
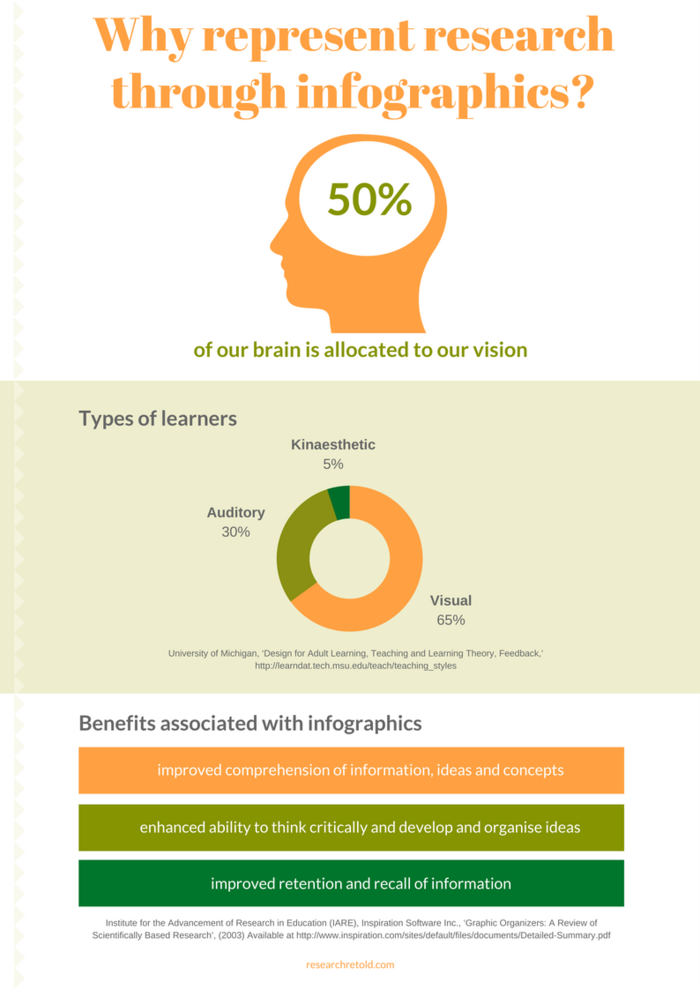
There is evidence to suggest that vision is one sensorial function through which we can absorb most information, with 50% of the human brain being allocated directly or indirectly to vision.
According to estimates published by the University of Michigan, 65% of the population are visual learners, as opposed to auditory learners ~30% and kinaesthetic learners ~5%, therefore the visual nature of infographics caters to a large portion of the population.
As a result, some of the learning benefits associated with infographics include ‘improved comprehension of information, ideas, and concepts, enhanced ability to think critically and develop and organise ideas, improved retention and recall of information.’ (IARE, 2003)
The search volume for infographics has exploded since 2010
This online behaviour has transformed them into critical tools for acquiring traffic and educating clients for many companies and news agencies.
Yet, their potential to communicate complex research findings to policymakers is currently highly underutilised.
A central feature that significantly contributes to this high traffic is their ‘shareability’ through the ‘word of mouse’, meaning their ability to spread digitally from person to person, which is not a surprise given their inherent aesthetic dimension.
Although research may exist to tackle particular policy issues, it often fails to reach policymakers and generate tangible impact because the research is presented in a complex, confusing manner.
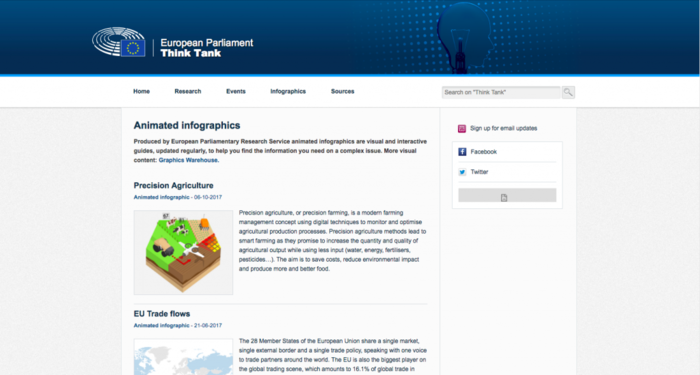
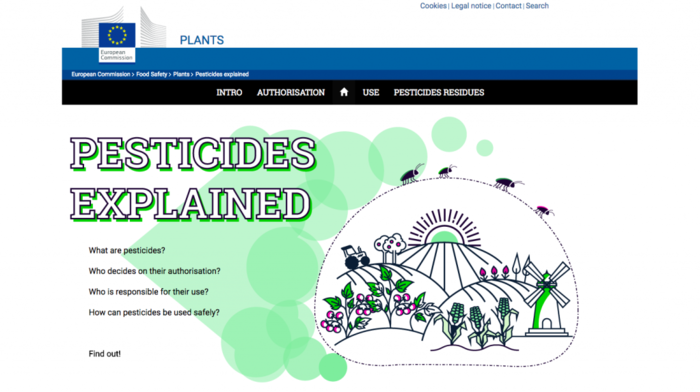
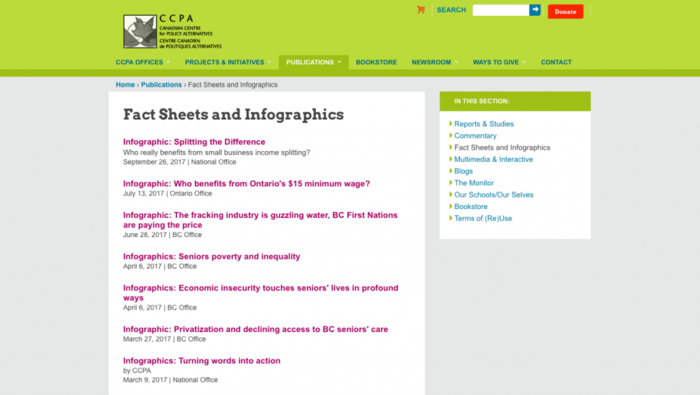
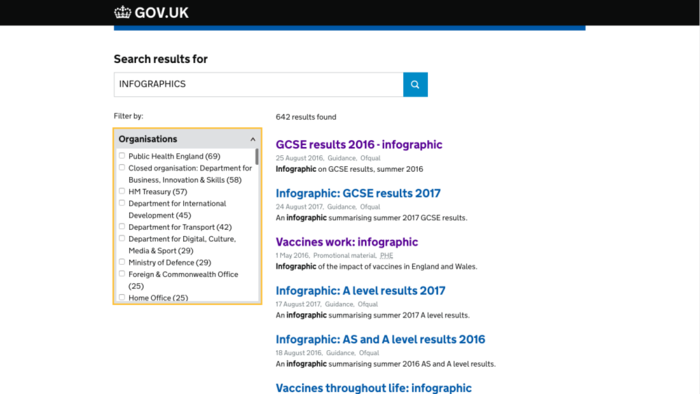
Government bodies themselves have visualised complex research in infographics to relate policy implications and engage their audiences. This illustrates receptiveness and appetite to this instrument of research communication.
These internal efforts by public bodies themselves should encourage researchers to adopt this instrument of communication as an external effort to generate policy impact.
Here are some examples:
In conclusion, infographics cannot guarantee impact. However, infographics spark interest and imagination, and are compatible with how we consume and access information today. For all these reasons, if your data allows it, presenting research in infographics is a good idea.
Have you seen any research studies successfully presented in an infographic format?
References
Smiciklas, M., ‘The Power of Infographics – Using pictures to communicate and connect with your audience’, QUE Pearson education (2012), pp. 1-189
University of Michigan, ‘Design for Adult Learning, Teaching and Learning Theory, Feedback’ (n.d.)
Institute for the Advancement of Research in Education (IARE), Inspiration Software Inc., ‘Graphic Organizers: A Review of Scientifically Based Research’, (2003)