
This blog post uses the art of making a cappuccino to explain how we visualise research findings.
We’ll talk about how we turn a cup of purified filtered coffee (i.e. the condensed research that looks bland) into a deliciously flavoured cappuccino (i.e. hello! visual document).
Let´s start!
A little review
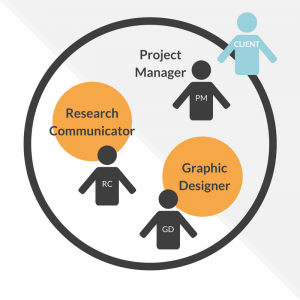
Our projects require a Project Manager (PM), a Research Communicator (RC) and a Graphic Designer (GD).
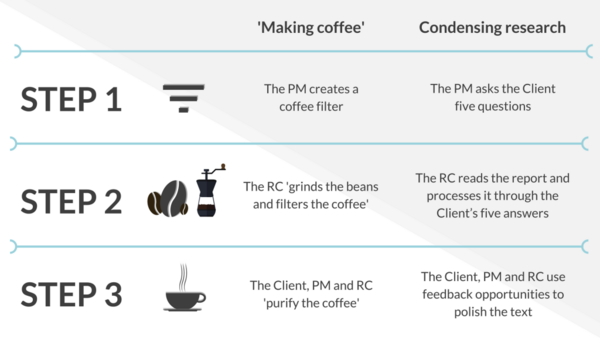
Last week we explained how the RC condenses research using a delicious coffee analogy:
For this post, indulge us in accepting these terms:
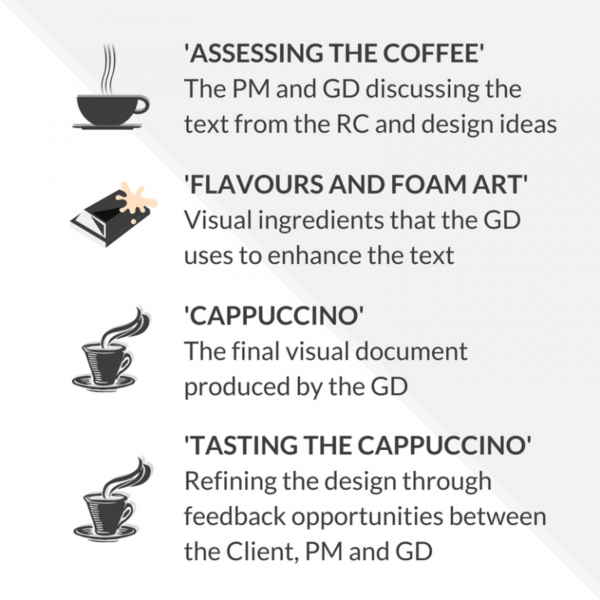
So how do we visualise research findings?

Step 1: ‘ASSESSING THE COFFEE’ (The PM and GD discuss design ideas considering five design aspects)
The PM and GD have a discussion about the existing text and potential design ideas to bring it to life. Some ideas may have emerged during the RC’s work, or the client may have expressed strong views about highlighting a specific section. During this discussion, the PM and GD consider five design aspects:
1) Are there any existing branding guidelines, or do we start from scratch? Any colours/fonts we should or shouldn’t use?
Sets the design tone. Most clients already have a starting point in terms of colour. For instance, clients may want the visual document that we produce to look similar, but not the same, with their funder’s branding. In this instance, we come up with a ‘cousin but not sister’ colour palette.
2) What logos, acknowledgements, external links, calls to action should be included in the visual document?
It’s good to know this from the beginning and reverse-engineer how to use the limited space available.
3) How will the document be disseminated, what format would suit the Client best (web/print)?
This informs the format and how to structure or section the content.
4) Is there anything in our portfolio that the Client likes? Any elements from our portfolio that they like?
It can give us a clear idea of what the client wants or, more importantly, what they do *not* want. For example, they may want to keep it an icon-heavy infographic-style or more editorial using photos.
5) What four words would be used to describe this research?
This can give help the designer with the tone and feel of the visual document.
Armed with the answers to these design aspects, the GD is ready to visualise the research from bland to hello!
Step 2: ‘FLAVOURING THE COFFEE AND MAKING FOAM ART’ (The GD visually interprets the text)
At this stage, the GD reads the ±1000-word summary produced by the RC. Going through each section, the GD reflects on ways to visually interpret the text and what illustrations and icons can best capture the message. While some sections can be clear and straightforward to visualise, some paragraphs are more abstract and require a bit of research and thinking.
There are some concepts that at first glance can be easy to illustrate, for example, a house. Yet, by taking into account the setting of the research, for example, rural Northern Nigeria, the icon changes significantly. In other words, think of making a cappuccino, choosing the right flavours, maybe nuttier, or more chocolatey, frothing the milk, adding sprinkles and then serving it into a crisp white mug. More importantly, it’s important to think about that first taste of the drink and how that experience feels overall.
In processing the text and picking the right ‘visual’ ingredients the GD chooses the right ‘ingredients’ and ‘flavours’ for the visual document. For example, colours, icons, illustrations, typeface, fonts, layout, positioning on the page and overall flow and look-and-feel. As a result, the condensed research is enhanced and brought to life with a unique combination of visual elements that make it stand out and is uniquely recognisable.
This process of unpacking complex subjects and visualising the words in ways that make the reader eager to discover the messages makes the job of a GD very satisfying. In his own words, James says:
“I immerse myself in the context of the narrative and dissect its technical construction to identify gaps or spaces that allow me to get creative, and to see whether and how to tell the same story differently or to tell a different story using the same evidence.
It is technical because it requires zooming in on the linkages between words/sentences and their meanings/messages. Yet, it is ultimately creative as any space or vulnerability identified between these two things is ceased upon to reconfigure the narrative.”
Step 3: ‘TASTING THE CAPPUCCINO (The Client, PM and GD use feedback opportunities to refine the design)
On the basis of the first designed version, three-four feedback opportunities between the Client, PM and GD refine and improve the design.
The PM has two roles in this process:
- To act as an interface between the Client and the GD
- To ensure quality control (i.e. that feedback is properly communicated and implemented)
In these iterations, our aim is to achieve a version of the design that the Client is 100% happy with. We offer our full availability and are always ready for a phone call or Skype to clarify any misunderstanding quickly and efficiently. At the end of these feedback opportunities, we usually have a 2-4 page beautifully designed document that is ready to be released into the world!
Conclusion
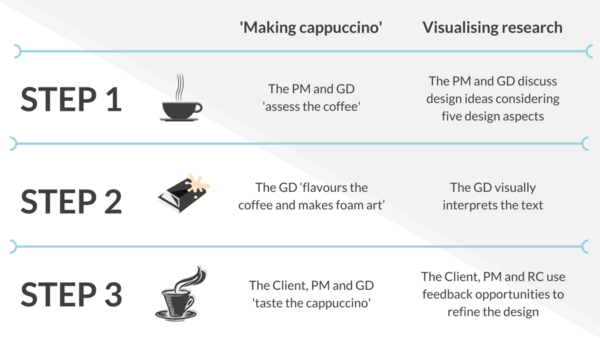
To visualise research the PM and GD discuss design ideas considering five design aspects, the GD processes and visually interprets the text and, finally, the Client, PM and GD use feedback opportunities to polish the text.
We enjoy this process and are always excited to learn and visualise research!
What do you think of our process? Did the cappuccino analogy make it easier to understand?